Temps forts
Remplacements
Joueur du match
- Dribbles réussis 1
- Duels gagnés 7/11 (63.64%)
- Passes réussies 44/52 (84.62%)
- But 1
Diffusion
Qui va gagner ?
Classement
| # | Équipe | Pts | J | G | N | D | |
|---|---|---|---|---|---|---|---|
| 6 |
|
63 | 38 | 18 | 9 | 11 | |
| 12 |
|
48 | 38 | 13 | 9 | 16 |
Classement buteurs
| # | Joueurs | Buts |
|---|---|---|
| 4 |
|
19 |
| 12 |
|
14 |
| 36 |
|
8 |
Compositions
Statistiques
Stats joueurs
- C. Gallagher 1
- C. Nkunku 1
- J. Kluivert 2
- A. Semenyo 2
- C. Palmer 1
- A. Semenyo 5
- N. Jackson 4
- E. Ünal 2
- N. Jackson 2
- A. Semenyo 3
- E. Ünal 2
- B. Badiashile 77
- C. Gallagher 76
- Marc Cucurella 11
- M. Senesi 10
- A. Semenyo 7
- N. Jackson 6
- M. Caicedo 3
- M. Senesi 3
- M. Senesi 3
- L. Cook 3
- M. Senesi 6
- Marc Cucurella 6
- A. Semenyo 4
- Thiago Silva 3
- T. Chalobah 3
- B. Badiashile 3
- A. Scott 1
- N. Jackson 1
- Neto 4
- Thiago Silva 57
- C. Gallagher 53
- Thiago Silva 52
- C. Gallagher 50
- C. Gallagher 2
- M. Kerkez 2
Série en cours
Derniers matchs
-
Anthony Taylor arbitre principal4.70.1Moyenne de cartons par match sur 28 matchs arbitrés
- Adam Nunn arbitre assistant
- Leigh Doughty quatrième arbitre
- Derek Eaton arbitre VAR
- Robert Jones arbitre VAR auxiliaire
- Gary Beswick arbitre assistant
- Année de construction : 1877
- Surface : pelouse naturelle
- Capacité : 40044
- Affluence moyenne : 31977
- Affluence maximum : 41953
- % de remplissage : 79
Résultat du match Chelsea Bournemouth
- Date 19 mai 2024 17:00
- Compétition Premier League
- Saison 2023/2024
- Phase Saison régulière - journée 38
- Affluence du match 39724
- Code CHE-BOU
- Zone Angleterre
- Equipe à domicile Chelsea
- Equipe à l'extérieur Bournemouth
Quel est le résultat du match Chelsea Bournemouth ?
Chelsea a gagné le match sur le score de 2-1
À quelle heure et sur quelle chaîne voir le match entre Chelsea et Bournemouth en france ?
Le match est à suivre à 17:00 en direct sur Multisports 3
Quelles sont les compositions officielles du match Chelsea Bournemouth ?
Chelsea : Entraînée par M. Pochettino, l'équipe évolue en 4-2-3-1 : Đ. Petrović, Marc Cucurella, B. Badiashile, Thiago Silva, T. Chalobah, C. Gallagher (C), M. Caicedo, R. Sterling, C. Palmer, N. Madueke, N. Jackson
Bournemouth : De son côté, l'équipe entraînée par Andoni Iraola, évolue en 4-2-3-1 : Neto (C), M. Kerkez, M. Senesi, I. Zabarnyi, M. Aarons, R. Christie, L. Cook, M. Tavernier, J. Kluivert, A. Semenyo, E. Ünal
Quel est l'arbitre du match Chelsea Bournemouth ?
Anthony Taylor arbitre cette rencontre
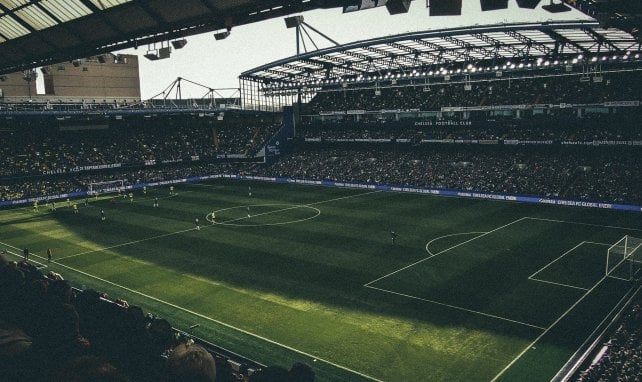
Où a lieu le match Chelsea Bournemouth ?
Le match est au stade Stamford Bridge à London
Quelle est la date et l'horaire du match Chelsea Bournemouth ?
Match à suivre en live sur Footdirect le 19 mai 2024, Coup d'envoi 17:00
Qui est l'homme du match Chelsea - Bournemouth ?
Moisés Caicedo s'est distingué lors de la rencontre Chelsea - Bournemouth. Ses stats témoignent de son impact :
- 1 Dribbles réussis
- 7/11 Duels gagnés (63.64%)
- 44/52 Passes réussies (84.62%)
- 1 But
-
-
28
Đ. Petrović
-
3
Marc Cucurella
-
5
B. Badiashile
-
6
Thiago Silva
-
14
T. Chalobah
-
23
(C)
C. Gallagher
-
25
M. Caicedo
-
7
R. Sterling
-
20
C. Palmer
-
11
N. Madueke
-
15
N. Jackson
-
28
Đ. Petrović
-
-
1
(C)
Neto
-
3
M. Kerkez
-
25
M. Senesi
-
27
I. Zabarnyi
-
37
M. Aarons
-
10
R. Christie
-
4
L. Cook
-
16
M. Tavernier
-
19
J. Kluivert
-
24
A. Semenyo
-
26
E. Ünal
-
1
(C)
Neto
-
-
 M. Pochettino Entraîneur
-
 A. Disasi
#2
- Défenseur
A. Disasi
#2
- Défenseur
-
C. Chukwuemeka
#17
- Milieu
-
C. Casadei #31 - Milieu89'
-
M. Gusto #27 - Défenseur64'
-
 M. Bettinelli
#13
- Gardien de but
M. Bettinelli
#13
- Gardien de but
-
A. Gilchrist
#42
- Défenseur
-
 C. Nkunku #18 - Attaquant64'
 -
L. Colwill
#26
- Défenseur
-
L. Ugochukwu #16 - Milieu64'
-
-
-
Andoni Iraola Entraîneur
-
 D. Solanke #9 - Attaquant60'
 -
 R. Faivre
#8
- Milieu
R. Faivre
#8
- Milieu
-
A. Scott #14 - Milieu69'
-
 M. Travers
#42
- Gardien de but
M. Travers
#42
- Gardien de but
-
 L. Kelly #5 - Défenseur84'
 -
D. Ouattara #11 - Attaquant59'
-
J. Hill
#23
- Défenseur
-
 P. Billing #29 - Milieu70'
 -
 A. Smith
#15
- Défenseur
A. Smith
#15
- Défenseur
-
- C. Palmer 1
- D. Solanke 50% (1/2)
- C. Nkunku 50% (1/2)
- R. Sterling 50% (1/2)
- M. Tavernier 50% (1/2)
- A. Semenyo 5
- N. Jackson 4
- R. Sterling 3
- N. Madueke 2
- E. Ünal 2
- N. Jackson 2
- C. Gallagher 2
- R. Christie 0% (0/3)
- J. Kluivert 0% (0/2)
- N. Jackson 25% (1/4)
- E. Ünal 25% (1/4)
- A. Semenyo 3
- C. Gallagher 75% (9/12)
- E. Ünal 67% (6/9)
- M. Caicedo 64% (7/11)
- M. Senesi 63% (10/16)
- M. Caicedo 3
- M. Senesi 3
- R. Christie 2
- T. Chalobah 2
- E. Ünal 83% (5/6)
- A. Semenyo 80% (4/5)
- M. Senesi 75% (3/4)
- Thiago Silva 50% (3/6)
- L. Cook 0% (0/5)
- J. Kluivert 0% (0/5)
- C. Palmer 0% (0/5)
- Thiago Silva 0% (0/4)
- M. Senesi 3
- L. Cook 3
- T. Chalobah 0% (0/3)
- D. Solanke 0% (0/2)
- I. Zabarnyi 0% (0/2)
- C. Casadei 0% (0/2)
- L. Cook 92% (33/36)
- Thiago Silva 91% (52/57)
- Marc Cucurella 88% (46/52)
- B. Badiashile 87% (55/63)
| # | Équipe | Pts | J | G | N | D | BP | BC | DIF | |
|---|---|---|---|---|---|---|---|---|---|---|
| 1 |
|
91 | 38 | 28 | 7 | 3 | 96 | 34 | 62 | |
| 2 |
|
89 | 38 | 28 | 5 | 5 | 91 | 29 | 62 | |
| 3 |
|
82 | 38 | 24 | 10 | 4 | 86 | 41 | 45 | |
| 4 |
|
68 | 38 | 20 | 8 | 10 | 76 | 61 | 15 | |
| 5 |
|
66 | 38 | 20 | 6 | 12 | 74 | 61 | 13 | |
| 6 |
|
63 | 38 | 18 | 9 | 11 | 77 | 63 | 14 | |
| 7 |
|
60 | 38 | 18 | 6 | 14 | 85 | 62 | 23 | |
| 8 |
|
60 | 38 | 18 | 6 | 14 | 57 | 58 | -1 | |
| 9 |
|
52 | 38 | 14 | 10 | 14 | 60 | 74 | -14 | |
| 10 |
|
49 | 38 | 13 | 10 | 15 | 57 | 58 | -1 | |
| 11 |
|
48 | 38 | 12 | 12 | 14 | 55 | 62 | -7 | |
| 12 |
|
48 | 38 | 13 | 9 | 16 | 54 | 67 | -13 | |
| 13 |
|
47 | 38 | 13 | 8 | 17 | 55 | 61 | -6 | |
| 14 |
|
46 | 38 | 13 | 7 | 18 | 50 | 65 | -15 | |
| 15 |
|
40 | 38 | 13 | 9 | 16 | 40 | 51 | -11 | |
| 16 |
|
39 | 38 | 10 | 9 | 19 | 56 | 65 | -9 | |
| 17 |
|
32 | 38 | 9 | 9 | 20 | 49 | 67 | -18 | |
| 18 |
|
26 | 38 | 6 | 8 | 24 | 52 | 85 | -33 | |
| 19 |
|
24 | 38 | 5 | 9 | 24 | 41 | 78 | -37 | |
| 20 |
|
16 | 38 | 3 | 7 | 28 | 35 | 104 | -69 |
- Relegation
| # | Équipe | Pts | J | G | N | D | BP | BC | DIF |
|---|---|---|---|---|---|---|---|---|---|
| 1 |
|
48 | 19 | 15 | 3 | 1 | 49 | 17 | 32 |
| 2 |
|
47 | 19 | 14 | 5 | 0 | 51 | 16 | 35 |
| 3 |
|
47 | 19 | 15 | 2 | 2 | 48 | 16 | 32 |
| 4 |
|
40 | 19 | 12 | 4 | 3 | 49 | 22 | 27 |
| 5 |
|
40 | 19 | 12 | 4 | 3 | 48 | 28 | 20 |
| 6 |
|
39 | 19 | 13 | 0 | 6 | 38 | 27 | 11 |
| 7 |
|
37 | 19 | 11 | 4 | 4 | 44 | 26 | 18 |
| 8 |
|
33 | 19 | 10 | 3 | 6 | 31 | 28 | 3 |
| 9 |
|
30 | 19 | 8 | 6 | 5 | 30 | 27 | 3 |
| 10 |
|
29 | 19 | 9 | 2 | 8 | 31 | 24 | 7 |
| 11 |
|
29 | 19 | 7 | 8 | 4 | 31 | 28 | 3 |
| 12 |
|
28 | 19 | 8 | 4 | 7 | 37 | 26 | 11 |
| 13 |
|
28 | 19 | 8 | 4 | 7 | 22 | 18 | 4 |
| 14 |
|
27 | 19 | 7 | 6 | 6 | 27 | 28 | -1 |
| 15 |
|
27 | 19 | 8 | 3 | 8 | 26 | 30 | -4 |
| 16 |
|
22 | 19 | 5 | 7 | 7 | 29 | 34 | -5 |
| 17 |
|
20 | 19 | 5 | 5 | 9 | 27 | 30 | -3 |
| 18 |
|
16 | 19 | 4 | 4 | 11 | 28 | 37 | -9 |
| 19 |
|
10 | 19 | 2 | 4 | 13 | 19 | 43 | -24 |
| 20 |
|
10 | 19 | 2 | 4 | 13 | 19 | 57 | -38 |
| # | Équipe | Pts | J | G | N | D | BP | BC | DIF |
|---|---|---|---|---|---|---|---|---|---|
| 1 |
|
44 | 19 | 14 | 2 | 3 | 45 | 18 | 27 |
| 2 |
|
42 | 19 | 13 | 3 | 3 | 43 | 13 | 30 |
| 3 |
|
34 | 19 | 9 | 7 | 3 | 37 | 24 | 13 |
| 4 |
|
28 | 19 | 8 | 4 | 7 | 28 | 33 | -5 |
| 5 |
|
27 | 19 | 7 | 6 | 6 | 36 | 34 | 2 |
| 6 |
|
27 | 19 | 8 | 3 | 8 | 26 | 30 | -4 |
| 7 |
|
26 | 19 | 7 | 5 | 7 | 33 | 37 | -4 |
| 8 |
|
23 | 19 | 7 | 2 | 10 | 29 | 46 | -17 |
| 9 |
|
21 | 19 | 6 | 3 | 10 | 27 | 39 | -12 |
| 10 |
|
21 | 19 | 5 | 6 | 8 | 20 | 32 | -12 |
| 11 |
|
20 | 19 | 6 | 2 | 11 | 36 | 40 | -4 |
| 12 |
|
20 | 19 | 5 | 5 | 9 | 18 | 33 | -15 |
| 13 |
|
19 | 19 | 5 | 4 | 10 | 24 | 35 | -11 |
| 14 |
|
18 | 19 | 4 | 6 | 9 | 25 | 35 | -10 |
| 15 |
|
18 | 19 | 4 | 6 | 9 | 24 | 37 | -13 |
| 16 |
|
17 | 19 | 5 | 2 | 12 | 27 | 31 | -4 |
| 17 |
|
16 | 19 | 4 | 4 | 11 | 22 | 37 | -15 |
| 18 |
|
14 | 19 | 3 | 5 | 11 | 22 | 35 | -13 |
| 19 |
|
10 | 19 | 2 | 4 | 13 | 24 | 48 | -24 |
| 20 |
|
6 | 19 | 1 | 3 | 15 | 16 | 47 | -31 |
| # | Équipe | Pts | J | G | N | D | BP | BC | DIF |
|---|---|---|---|---|---|---|---|---|---|
| 1 |
|
73 | 38 | 21 | 10 | 7 | 40 | 16 | 24 |
| 2 |
|
70 | 38 | 18 | 16 | 4 | 42 | 12 | 30 |
| 3 |
|
61 | 38 | 14 | 19 | 5 | 37 | 23 | 14 |
| 4 |
|
60 | 38 | 16 | 12 | 10 | 36 | 21 | 15 |
| 5 |
|
58 | 38 | 14 | 16 | 8 | 32 | 21 | 11 |
| 6 |
|
56 | 38 | 13 | 17 | 8 | 37 | 23 | 14 |
| 7 |
|
55 | 38 | 12 | 19 | 7 | 24 | 19 | 5 |
| 8 |
|
50 | 38 | 13 | 11 | 14 | 25 | 34 | -9 |
| 9 |
|
48 | 38 | 12 | 12 | 14 | 23 | 29 | -6 |
| 10 |
|
48 | 38 | 11 | 15 | 12 | 26 | 30 | -4 |
| 11 |
|
47 | 38 | 10 | 17 | 11 | 22 | 23 | -1 |
| 12 |
|
46 | 38 | 10 | 16 | 12 | 19 | 27 | -8 |
| 13 |
|
45 | 38 | 9 | 18 | 11 | 22 | 22 | 0 |
| 14 |
|
44 | 38 | 8 | 20 | 10 | 17 | 23 | -6 |
| 15 |
|
43 | 38 | 10 | 13 | 15 | 18 | 30 | -12 |
| 16 |
|
43 | 38 | 8 | 19 | 11 | 21 | 26 | -5 |
| 17 |
|
40 | 38 | 7 | 19 | 12 | 24 | 31 | -7 |
| 18 |
|
38 | 38 | 9 | 11 | 18 | 20 | 30 | -10 |
| 19 |
|
34 | 38 | 8 | 10 | 20 | 18 | 36 | -18 |
| 20 |
|
28 | 38 | 4 | 16 | 18 | 14 | 41 | -27 |